

Who Can We Trust? Episode 1.
TLDR: R0 is a critically important measure, but it changes with time and population behavior, and is subject to great error
What is R0?

R0 (pronounced R-naught) is an estimate of the number of new cases that will stem from a single case (or patient zero). For example, if R0 is 2, that means each patient will infect two more.

Scientists calculate R0 with some forensic evidence, but it is essentially an educated guess. Scientists examine the characteristics of a disease and how it spreads while considering the impact of human behavior to calculate R0. This helps to approximate the disease’s trajectory.
How could they be so wrong?

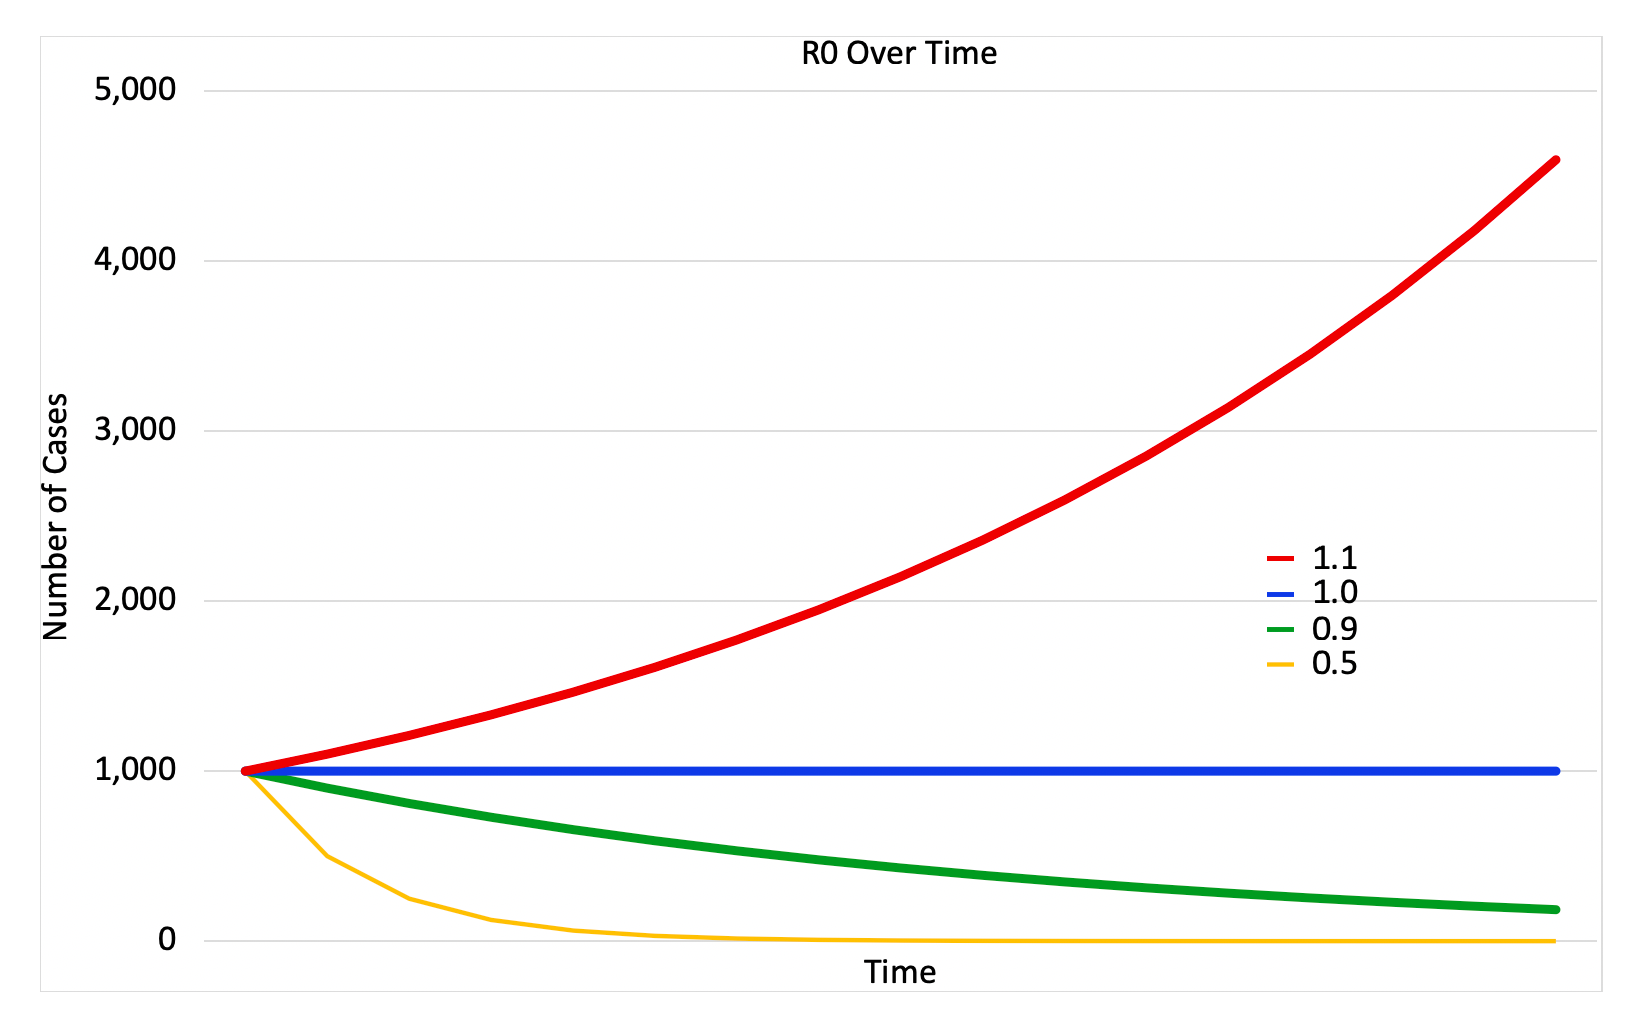
The graph above (from the BBC) is an example of why we can’t blindly trust even major news outlets. If R0 is greater than 1, the number of infected persons is growing. The BBC graph shows that when R0 = 0.5 or 0.9, the rate of infection would still increase slowly. This is incorrect; when R0 is less than 1, there would be fewer infections over time, as illustrated in the corrected graph below.
Why is it so complicated?
Different diseases have varying R0 because of the differences in their aggressive natures. Because R0 is essentially an educated guess, it is not always accurate. The R0 for measles has been estimated to be between 3.7 and 203. This is not the degree of precision we would prefer, and it illustrates the messiness inherent to R0 estimates.
This imprecision is in part because human behavior is unpredictable. People’s willingness to follow recommendations from health officials and scientists significantly change R0. Even things like weather, holidays, the economy, and current events change human behavior and, ultimately, R0.
What does R0 mean for Covid-19?
The current R0 number for the pathogen that causes Covid-19 is about 2.2 nationwide. That is significantly higher than Influenza’s R0 of about 1.3 and even the 1.8 estimated for the 1918 Spanish Flu.
Health officials’ goal is to get Covid’s R0 below 1, which would mean that the disease would slowly decrease over time. So, how do we get there? By looking at past infection rates, the policies the public was expected to follow, and their effect on infection rates, government officials can make better-informed decisions.
R0 is also used to determine how quickly cases are growing. It determines how well the government’s past restrictions and policies decreased the spread of disease, and if these policies are worth their economic and social damage. It also helps to determine whether more aggressive restrictions are needed.

The graph above shows the estimated R0 for SARS-CoV-2 in Texas over time. The R0 for SARS-CoV-2 began to decline before shelter in place orders were issued because individuals began to self-quarantine. At the same time, influenza virtually disappeared, and for the same reasons.
To Summarize
By watching the effects that individual and population behaviors have on R0, public health authorities can refine advice about how to minimize risk while reopening businesses and resuming social activity. Breakthroughs in the treatment of COVID-19 (or any other disease) do not first appear on the local news or in a viral YouTube video. These should be simply ignored.
But we also must remember that just because the information we see comes from a historically reliable source (such as the BBC), we still have to consider whether it is credible and accurate.